In this tyre manufacturing industry case study, a leading 2 and 3-wheeler tyre manufacturer aimed to optimize their operations for global leadership. The study focused on indirect area processes, utilizing time analysis, strategic work distribution, resource evaluation, and lean waste reduction. The study's insights promise operational excellence and align with the client's vision for safer, smarter global mobility.
Increased workforce utilization to 84.2% from 66.6%.
Client's Challenge
Standardization of work content based historical data and client site data.
Muda & Muri analysis for further improvement.
Identify true Manpower requirement of plant.
PMI's Approach
The study was organized in a 3-stage process:
Data Collection –
Plant round to understand the scope of work.
Interaction with respective area owners/executives to understand the various activities carried out in the area.
Data requirement sent to area owners for logs of various activities.
Estimation & Data Analysis – Time/stopwatch study done on sample basis for some activities, work distribution, Resource Calculation, Lean waste analysis.
Results and Conclusion –Improved productivity, improved manpower utilization, identification of NVA work content.
Involvement of Associates –
PMI – 1 Project Manager, 2 Engineers.
Client – 1 Project Co-ordinators, Area Managers of various areas and some Associates.
Data Collection:
Plant round to understand the scope of work.
Interaction with respective area owners/executives to understand the various activities carried out in the area.
Data requirement sent to area owners for logs of various activities.
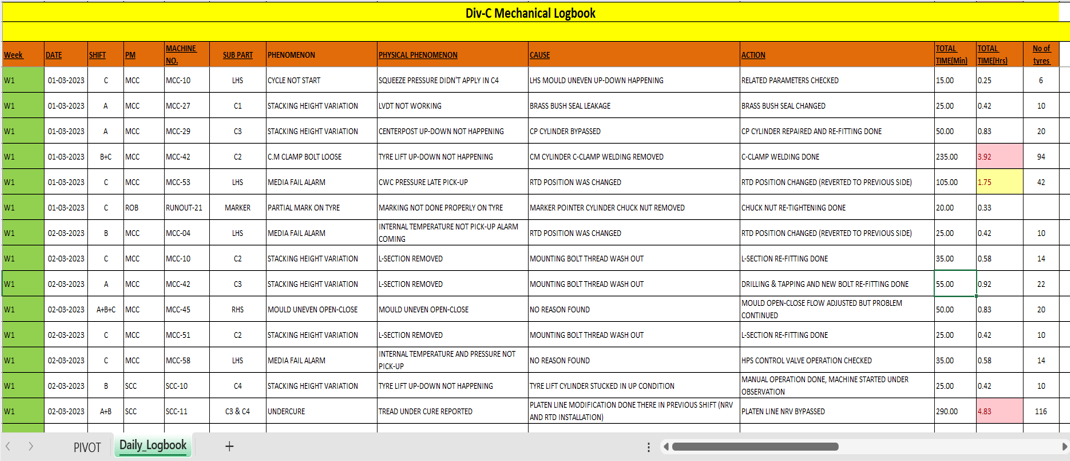
Receiving Logs of Breakdowns, Preventive Maintenance activities and other activities such as Daily activities, Tests carried out in QA labs for last 6 months, also some other activities such as Time and Condition based Monitoring list from client.
Interaction with client to understand documents and processes.
Data Analysis:
Preparation of activities work content by time study and validation by client.
Analysis (Work distribution/VA-NVA identification) for manpower calculation, optimum manpower utilization.
Improvement & suggestions for reducing Lean wastes and making existing system better.
Sample Analysis of Process Audit area
Results & Conclusion
After doing analysis and evaluation following results were obtained –
Improved productivity by 60%.
Manpower utilization rose from average of 66.6% to an average of 84.2%.
Lean waste analysis for future improvement.
Improvements and Suggestions
Let our experts show you how our Services can support your projects!
Send a message to our team by filling out the form below. Describe your project, ask questions, or even request a bid. An expert from our team will be in touch with you within one business day!
Want to schedule a time to speak with one of our representatives NOW?