Production-Analysis-Skid-and-Trolley-Analysis-in-Car-Manufacturing-Industry

Abstract

This project report presents a comprehensive production analysis carried out for a global automotive equipment manufacturer specializing in body-in-white closures and exhaust systems. The client aimed to validate throughput capabilities and identify potential bottlenecks within their integrated production line. To support these goals, Production Modeling India Pvt. Ltd. (PMI) conducted a simulation-based study, leveraging a six-phase methodology to ensure data-driven insights and robust validation.
The simulation model revealed a system-wide line efficiency of 93.4%, with a throughput capacity exceeding the target by 4.5%. Material handling station 5C-010 was identified as the primary bottleneck due to its high utilization. Downtime interactions and buffer effectiveness between critical zones were also evaluated, confirming that the planned three-buffer system was adequate to manage flow disruptions.
This analysis enabled the client to validate the effectiveness of their system layout, fine-tune buffer placement, and prioritize improvements around high-impact stations. The simulation model remains adaptable for future design iterations and scenario testing.

Introduction

The contemporary automobile production setting requires maximum efficiency, flexibility, and accuracy. With the intensified competition and declining product lifecycles, manufacturers have no option but to utilize advanced tools in order to design, verify, and optimize their manufacturing systems before large-scale deployment. Simulation-based production analysis is one such method, which delivers a virtual yet realistic assessment of factory operation in different conditions.
This report documents a simulation study of Production Modeling India Pvt. Ltd. (PMI) for a leading global automotive company. The client specializes in body-in-white closures, exhaust systems, and turn-key manufacturing equipment solutions. Their production strategy, known as the "Full Vertical Approach," integrates design, tooling, and manufacturing in a tightly coordinated manner. A detailed simulation was required to ensure the proposed manufacturing setup could achieve the desired throughput and operational stability.
The primary intent of this study was to validate system capacity, identify bottlenecks, understand downtime behavior, and test buffer strategies. By building a dynamic and adaptable simulation model, PMI enabled the client to evaluate the real-world performance of their production line in a risk-free digital environment, supporting proactive decision-making and system optimization.

Objectives

The primary objective of this project was to conduct a simulation-based evaluation of a proposed production system within a car manufacturing facility. The client sought to validate whether the system design could support the targeted throughput while maintaining high operational efficiency and minimal downtime interference. The specific goals of the study were as follows:

These objectives were addressed using a structured simulation methodology, ensuring both accuracy and flexibility in outcomes.

Production Analysis of Car Manufacturing System Using Simulation

Methodology

The simulation study was executed using a structured six-stage methodology developed by Production Modeling India Pvt. Ltd. (PMI). This approach ensures thorough data validation, systematic model development, and actionable insights for the client.

Data Verification & Static Analysis

The initial phase involved reviewing all input data provided by the client. This included robotic timing sheets, layout details, equipment specifications, and operational constraints. PMI converted raw robotic timings into event-based activity cycle times and performed static calculations to estimate:
• Expected throughput
• Machine downtimes (MTBF/MTTR)
• Utilization levels for stations and equipment
These theoretical outputs served as a baseline for validating the simulation model.

Conceptualization

PMI examined the client’s manufacturing logic and flow, identifying key constraints such as:
• Unsynchronized tip changes on welding robots
• Downtime interactions across stations
• Sealer purge operations
• Weld take-out for inspection
A flexible model structure was conceptualized to accommodate dynamic adjustments during the study.

Model Building and Verification

A discrete event simulation model was developed using industry-standard software. The model incorporated:
• Machine cycles and changeovers
• Material handling (MH) systems and buffers
• Sealer and welding robot behavior
• Downtime zones and shift patterns
The model’s outputs were compared against the static analysis results to ensure accuracy and realistic system behavior.

Scenario Testing

Various what-if scenarios were tested to evaluate the impact of:
• Station cycle time variations
• Buffer modifications
• Downtime interactions
• Material handling equipment counts
These simulations helped identify optimal operating conditions and system thresholds.

Results Compilatio

Simulation outputs were analyzed to identify key metrics such as:
• Throughput (Gross and Net JPH)
• Line efficiency
• Bottlenecks
• Machine and station utilization
Data from multiple runs was tabulated and visualized to assist client interpretation.

Recommendations and Reporting

PMI compiled all results, insights, and suggestions into a comprehensive report. The findings were structured to directly support client decision-making for layout improvements and throughput planning.
Collaboration involved 1 Project Manager and 1 Engineer from PMI, working closely with 2 Project Coordinators from the client’s team.

Implementation and Simulation Setup

The simulation model represented a full-scale production line used for manufacturing automotive closures and related components. This line was divided into distinct operational zones and incorporated various robotic and manual stations, material handling systems, and buffers. The implementation phase focused on accurately replicating the line’s functional behavior in a virtual environment.

System Configuration

The system comprised:
• Turntables, welding robots, and sealers across multiple stations
• Material handling robots (MH1–MH10) with defined routing and operation cycles
• Three key downtime zones, between which buffer placement was critical
• Event-driven operations, including changeovers, sealer purging, tip dressings, and inspection-based weld take-outsA small river named Duden flows by their place and supplies it with the necessary regelialia.
It is a paradisematic country, in which

Data Integration

Input data included:
• Detailed robotic timing sheets
• MTBF (Mean Time Between Failures) and MTTR (Mean Time To Repair) values for each station
• Layout and logic for station interdependencies
• Skid, trolley, and MHE (Material Handling Equipment) counts
Static analysis was used to estimate:
• Station-wise availability and utilization
• Impact of cumulative downtimes
• Line capacity under theoretical conditions

Model Behavior

The simulation accounted for:
• Realistic failure and repair patterns
• Buffer interactions and their impact on line continuity
• Dynamic product flow, synchronized with process constraints
• Cycle time variability across zones

Verification

Model outputs were cross-validated against static estimates, ensuring that the behavior aligned with known benchmarks before running optimization scenarios.
By faithfully representing both physical constraints and operational logic, the simulation environment enabled precise experimentation without disrupting actual production.

Results and Analysis

The simulation study provided critical insights into the performance and limitations of the proposed production system. Using both baseline runs and scenario testing, key metrics were analyzed to validate system capabilities and uncover opportunities for improvement.

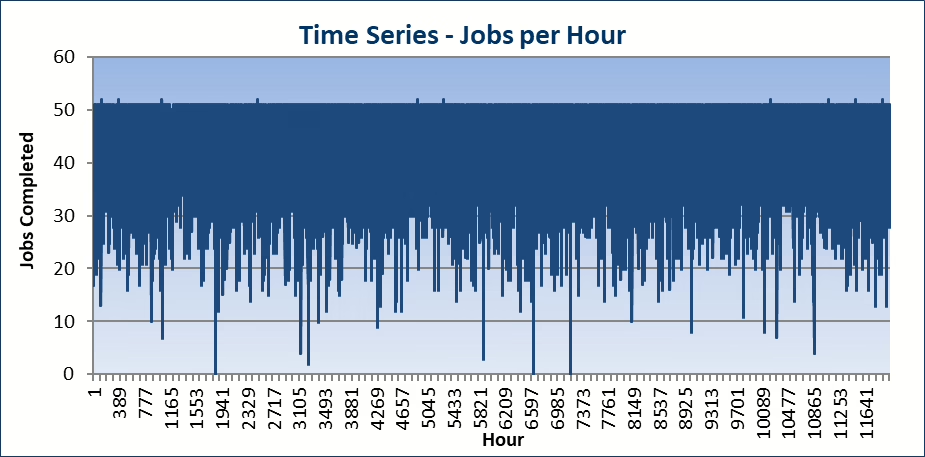
• The system exceeded its baseline production target by 4.5%, demonstrating sufficient capacity under realistic conditions.
• Gross Jobs Per Hour (JPH) was calculated at 51.6, while Net JPH stood at 47.4 for Zone 1, affirming the efficiency of the flow with minor acceptable losses.
• The line achieved an overall efficiency of 93.4%, confirming the viability of the current setup (Appendix 1).

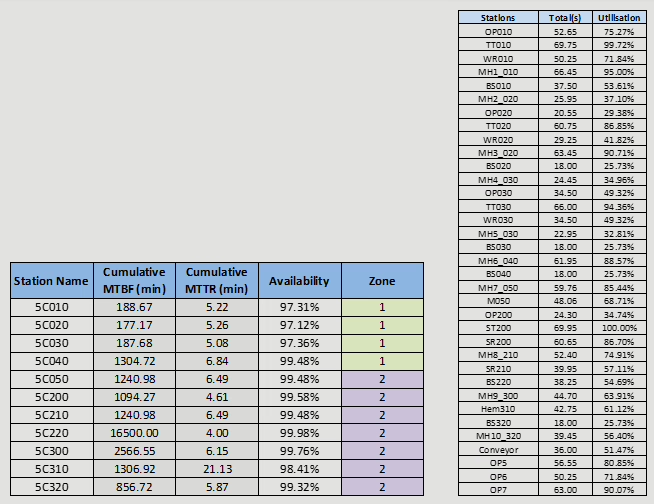
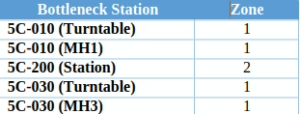
The model revealed five critical bottlenecks:

Among these, 5C-010 emerged as the primary bottleneck, limiting line throughput and impacting adjacent stations (Appendix 4).


Utilization varied widely across the line. Examples include:
• TT010: 99.7% (near-saturation)
• WR010: 71.8%
• MH2_020: 37.1%
• BS020: 25.7%
These figures highlighted both heavily loaded and underutilized stations, guiding focus areas for balancing workloads.

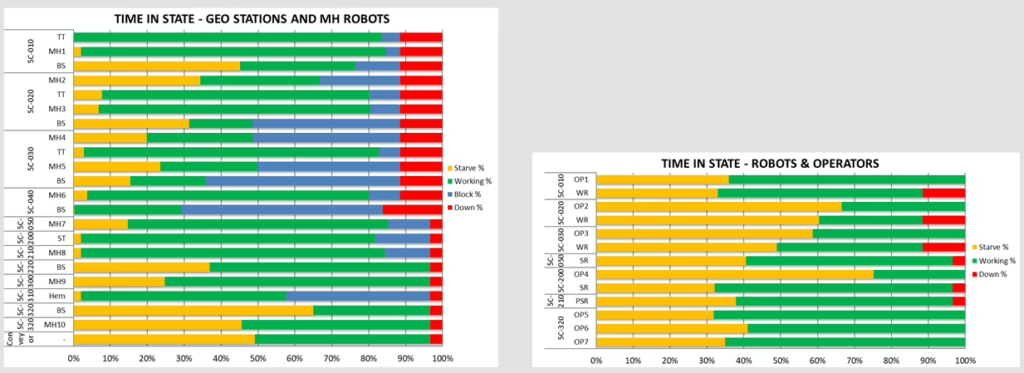
  • The system employed three buffers between downtime zones, which proved sufficient in preventing system-wide blockages.
  • Buffer sizing and location helped absorb disruptions from sealer purges, tip changes, and inspection-induced delays.
  • MTBF and MTTR calculations revealed that while most stations had availability above 97%, some zones required intervention to reduce mean repair times and improve local availability.
  • Zone 1 displayed slightly higher operational volatility due to clustered high-utilization stations.

The simulation model was built with modular logic, allowing:

  • Integration of additional stations
  • Adjustment of cycle times
  • Tweaking of downtime parameters

This adaptability makes it a valuable decision-support tool for future modifications and expansions.

Key Findings and Recommendations

The simulation study produced several findings of utmost importance that enabled the client to comprehend the behavior and limitations of their manufacturing system. These insights are pivotal for both immediate optimization and long-term scalability.

Key Findings:

Production Throughput

The system can exceed the target throughput by 4.5%, offering a performance cushion.

Buffer Zones Validated

The placement of three buffers between downtime zones was found sufficient to manage flow disruptions without compromising throughput.

Bottlenecks Identified

Station 5C-010 was confirmed as the primary bottleneck, impacting upstream and downstream flow. Other stations like 5C-200 and 5C-030 also contributed to performance constraints (Appendix 1).

Line Efficiency

The overall line achieved 93.4% efficiency, indicating good synchronization with scope for further fine-tuning.

Underutilized Resources

Several stations exhibited low utilization, highlighting an imbalance in task distribution or possible redesign opportunities.

Downtime Sensitivity

System performance is moderately sensitive to maintenance events like tip changes, sealer purging, and weld take-outs. Downtime zones need periodic monitoring.

Recommendations:

Address Bottlenecks First

Prioritize rebalancing or upgrading 5C-010 and its related MH station to unlock further capacity.

Optimize Resource Allocation

Reassign tasks or redesign processes at underutilized stations to enhance system-wide balance.

Leverage Model Flexibility

Use the existing simulation model for testing future layout changes, maintenance schedules, and cycle time improvements.

Implement Targeted Maintenance

Reduce MTTR at critical stations to boost availability in high-impact zones.

Conclusion

The simulation-based production analysis conducted by Production Modeling India Pvt. Ltd. successfully validated the client's proposed manufacturing system for body-in-white automotive components. The study confirmed that the current setup not only meets but slightly exceeds the target throughput, achieving 93.4% efficiency under modeled conditions.

Key constraints, such as bottleneck stations, downtime interactions, and buffer effectiveness, were clearly identified, enabling the client to prioritize improvement areas. The flexible simulation model offers an ongoing advantage, allowing for further iterations and testing without disrupting actual production.

By incorporating data-driven information and predictive modeling, the client now possesses a superior capability to enhance efficiency and productivity while minimizing risk. It can also plan for future expansions or changes in the system confidently

    Download Our Company Brochure