Introduction
The automobile sector is always adapting to shifting market conditions and advancing innovation and technology. Thus, the automobile companies badly need to enhance their delivery and quality. The performance of any plant can be measured at End-of-line (EOL), where all systems must converge smoothly to inspect, test, and calibrate the vehicles to make them ready for dispatch. This critical stage had become a quiet bottleneck for one of the world’s leading vehicle manufacturers.
As production volumes increased, the company needed to right-size its EOL operations, particularly the number of drivers, test stations, and parking spots, to maintain output without over-investing in resources. To navigate this operational puzzle, they turned to Production Modeling India (PMI) to simulate the EOL system and validate improvement strategies, before making any physical or capital-intensive changes.
Client’s Challenge
• Underperformance of the EOL zone—delivering only 65% of the desired daily output
• Lack of clarity on the optimal number of drivers needed for moving vehicles between testing and inspection points
• Overcrowded parking zones, driver underutilization, and repair-related delays
• Need to determine how first-time-through (FTT) failure rates were impacting flow and how much quality improvement was necessary to maintain production targets
PMI’s Simul8 Strategy Reduces FTT Failures, Lifts End of Line Throughput by 30% - A Case Study
PMI’s Simulation Strategy
PMI’s multi-layered approach combined real-world data with detailed modeling:
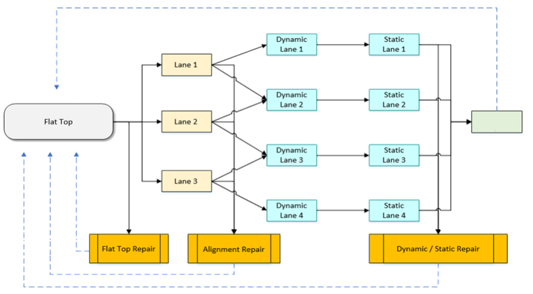
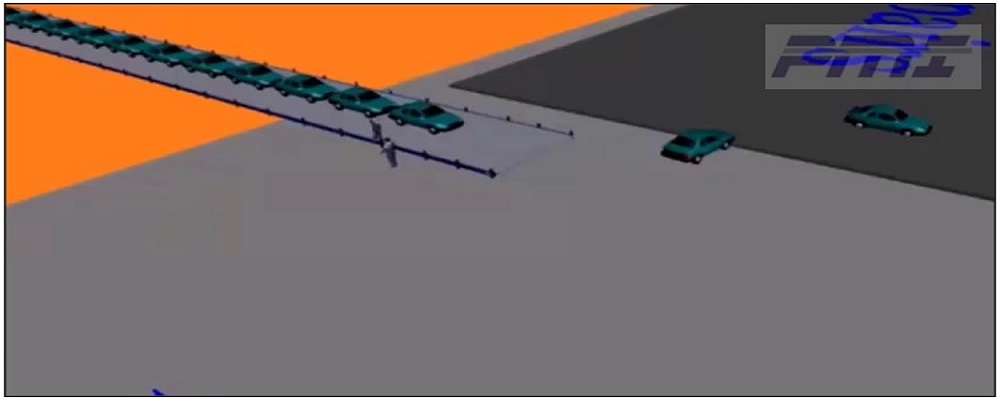
The EOL process was mapped comprehensively—right from post-assembly handoff to the final vehicle dispatch. All major activities, such as inspection, calibration, repair, and staging, were represented.
Using real-time data from the plant floor, station cycle times were modeled to reflect realistic variability and performance levels.
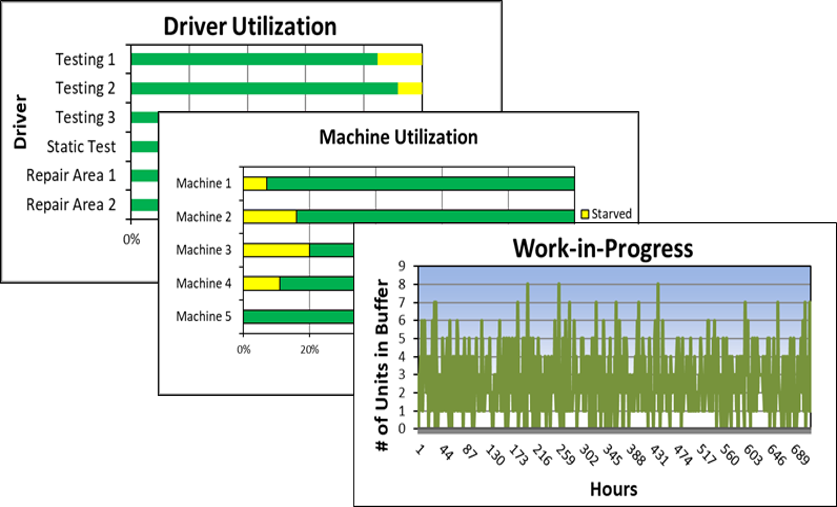
PMI simulated multiple production days under varying FTT rates. Metrics like queue sizes, driver utilization, and equipment downtimes were tracked across different scenarios.
Key Findings & Recommendations
The simulation revealed a series of performance chokepoints:
• The calibration test drivers emerged as the primary constraint. PMI found that vehicles were queuing up due to a shortage of personnel for maneuvering them through test bays.
Recommendation: Add 2 additional drivers. This simple change resulted in a 30% increase in throughput, pushing output closer to the target with minimal investment.
• The second constraint lay in the body repair stations. With high FTT failures, these stations became overloaded, creating a drag on the entire system.
Recommendation: Improve repair station cycle time by 50% through better staffing and work reorganization. This ensured vehicles spent less time waiting and more time moving toward dispatch.
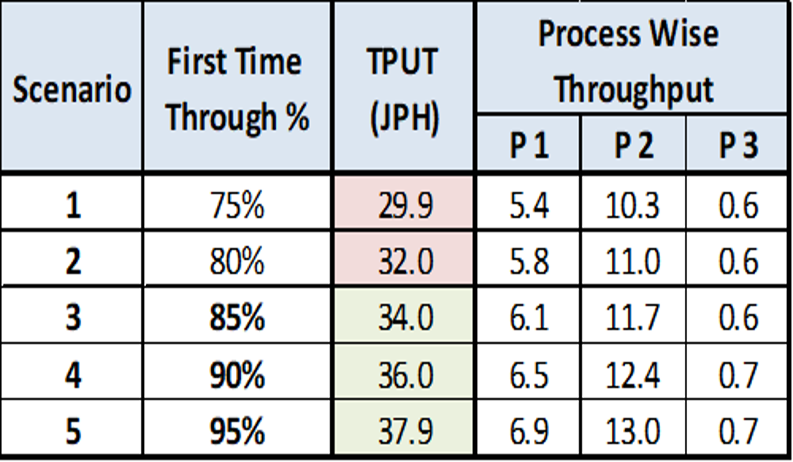
• A sensitivity analysis on FTT rates revealed that to consistently meet daily production targets, at least 75% of vehicles must pass inspection on the first attempt.
Recommendation: Introduce process improvements upstream to improve initial quality and reduce EOL congestion.
Conclusion
By blending data with simulation, PMI enabled the client to see their EOL process not just as a physical space, but as a living system—with its own rhythm, constraints, and opportunities. The simulation didn’t just pinpoint problems; it empowered the client with actionable solutions to maximize efficiency, minimize delay, and avoid over-capitalization.
In a factory where every vehicle counts, the right drivers—and the right decisions—can steer the entire system toward success.