Optimizing Aeronautical Operations Efficiency with Time and Motion Study
August 18, 2023
Optimizing Aeronautical Operations Efficiency with Time and Motion Study

mbawankar |
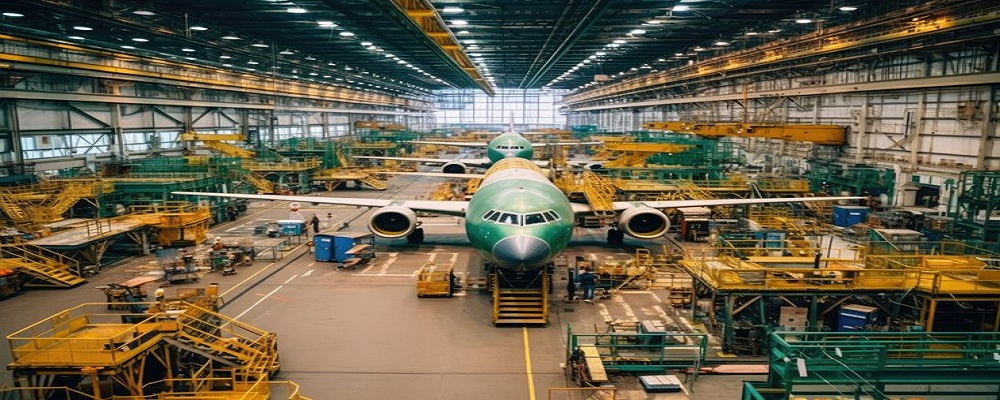
The client is a prestigious aeronautical firm, prioritizes passenger convenience by enhancing post-flight and pre-flight tasks. Through rigorous time and motion study, the company aims to eliminate delays, optimize resources, and ensure seamless operations. This case study underscores the commitment to refining aeronautical practices, aligning with the vision of passenger-centric excellence.
Key Points
- Time & Motion study for identified areas. (Apron Area, Baggage Breakup Area)
Analysis to determine -
- What can be achieved in perfect condition
- What is realistically achievable on a consistent basis
- What is currently being achieved
- Controllable variables & allowances
- Uncontrollable variables & allowances
Client's Challenge
- Delay on daily basis of identified areas under operations.
- To streamline the operations for smooth flow of baggage.
- Sustain and maintain the improved conditions for improvised points in the operations.
PMI's Approach
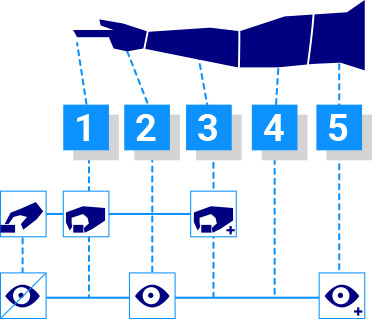
The study was organized in a 3-stage process:
- Data Collection – In person observations of all activities under scope.
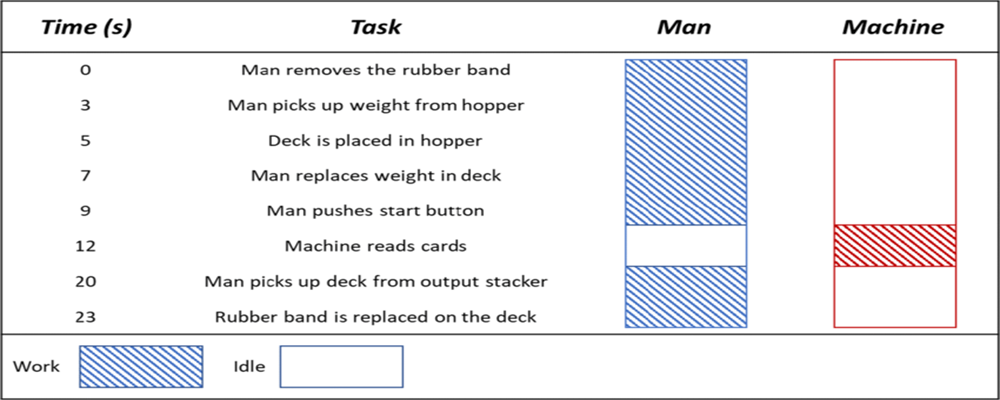
- Estimation & Data Analysis – Time & Motion study, Work sampling, Production study.
- Results and Conclusion - Improved productivity, Improved manpower utilization, identification of NVA work content.
Involvement of Associates –
- PMI – 1 Project Manager, 3 Engineers.
- Client – 2 Project Co-ordinators.
Data Collection:
- Visiting client site and performing CFT formation and site round.
- Data collection in person observations of all activities under scope with more than 70 observations per day considering peak and off peak timings.
- Interaction with client to understand process and timely observations.
Data Analysis:
- Preparation of excel sheet using work sampling & validation by client.
- Analysis (Work distribution/VA-NVA identification) for manpower calculation, optimum manpower utilization & identifying capacity.
- Dashboard preparation.
- Improvement & suggestions for fatigue reduction & making existing system better.
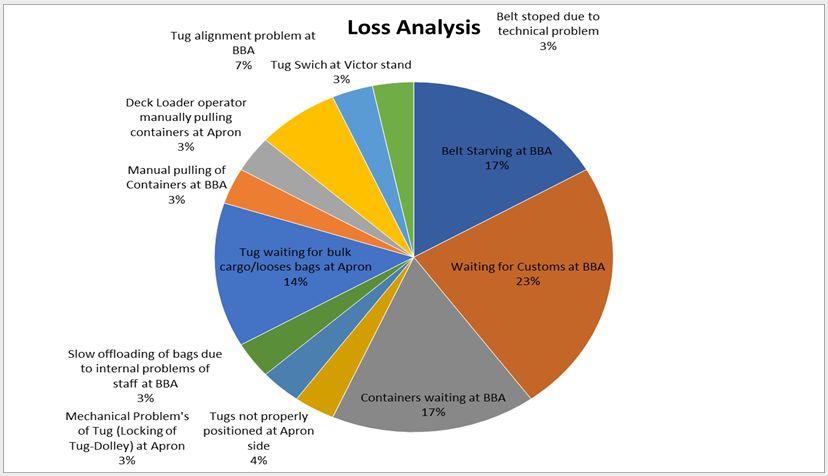
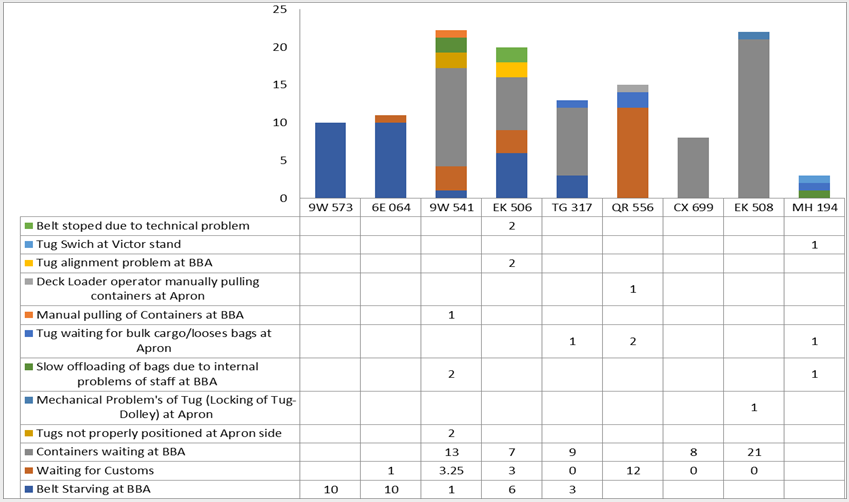
Results & Conclusion
After doing analysis and evaluation following results were obtained –
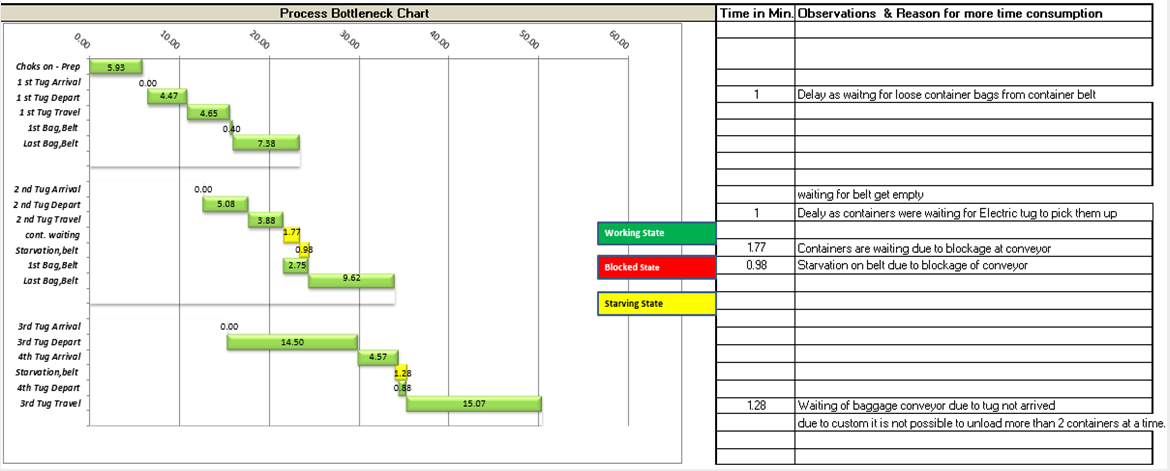
- Detailed analysed losses identified for collected observation.
- Recommendations under constraints for productivity improvement.
Let our experts show you how our Services can support your projects!
Send a message to our team by filling out the form below. Describe your project, ask questions, or even request a bid.
An expert from our team will be in touch with you within one business day!
Want to schedule a time to speak with one of our representatives NOW?
mbawankar
Recent posts
Time and Motion Studies Explained
Read moreYou may also like

Resources Optimization and Capacity Analysis in Electronics Manufacturing Industry
mbawankar | September 8, 2023
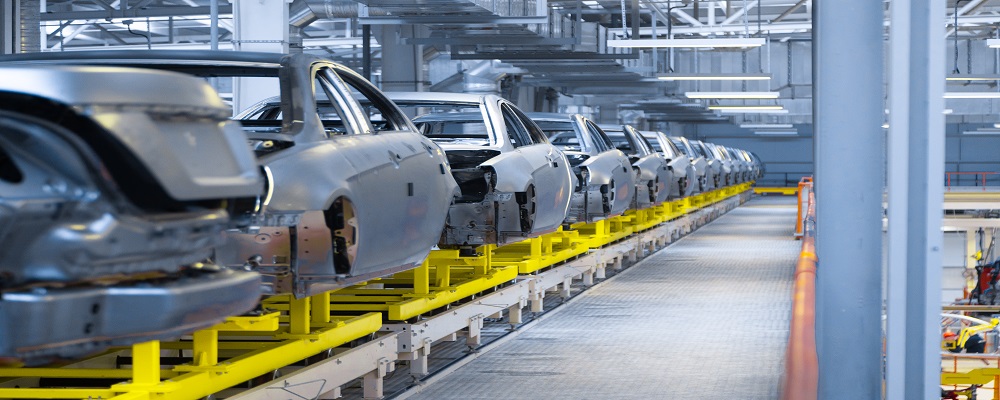
Analyzing Production in Car Manufacturing Industry through Simulation Study
mbawankar | September 8, 2023