Productivity Improvement in Agricultural Equipment Manufacturing Industry
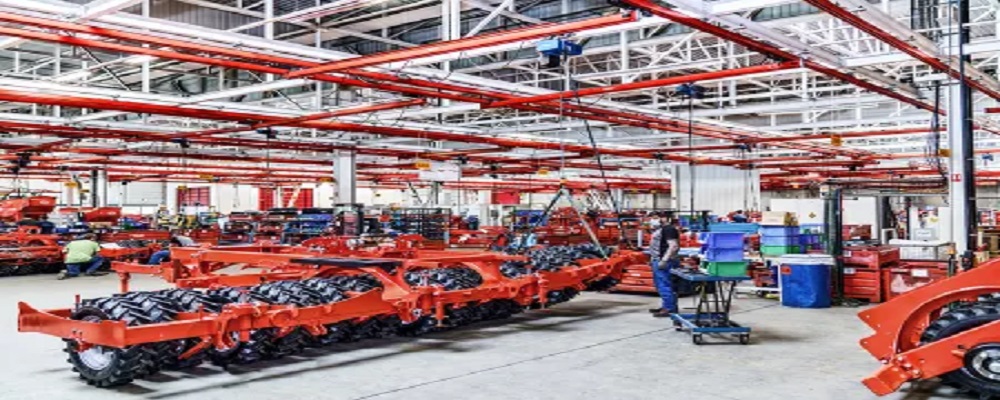

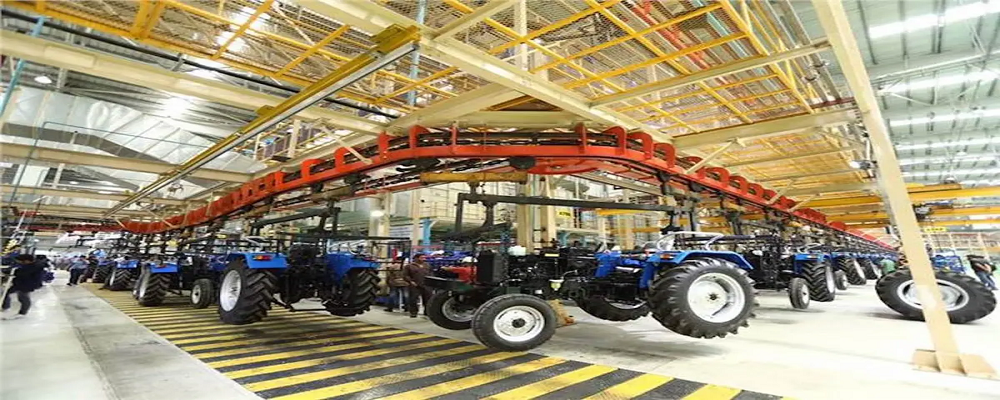
This case study highlights a leading Agricultural Equipment manufacturer with a vision to lead global innovation. Objectives encompassed work analysis through PMTS, line balancing, optimizing manpower distribution, calculating machine utilization, and resource allocation. The study's focal point was Value-Added and Non-Value-Added analysis. The client aimed for efficiency, elevating their potential to revolutionize agriculture products on a global scale.
Key Points
For Existing Production capacity of 3000 units per month
- Productivity improvement by 49.7%.
- Manpower reduction by 33.2%
For Proposed Production capacity of 4500 units per month
- Productivity improvement by 67.3%.
- Manpower reduction by 40.2%
Client's Challenge
- Reduction in manpower fatigue.
- Dashboards for production planning as per demand.
- VA/NVA analysis for further improvement.
- Identify true potential capacity of plant.
- Low manpower utilization.
- Layout Modification
- Low-Cost Automation
PMI's Approach
The study was organized in a 3-stage process:
- Data Collection - Video shooting of all activities on the line.
- Estimation & Data Analysis – Basic MOST estimation, work distribution, dashboard preparation, VA/NVA analysis.
- Results and Conclusion – Dashboards for future planning, fatigue reduction, improved productivity, improved manpower utilization, identification of NVA work content.
Involvement of Associates –
- PMI – 1 Project Manager, 2 Engineers.
- Client – 2 Project Co-ordinators.
Data Collection:
- Recording videos by PMI Engineers.
- Interaction with client to understand process.
- Production Data for last 6 month.
Data Analysis:
- Preparation of elemental details using PMTS technique & validation by client.
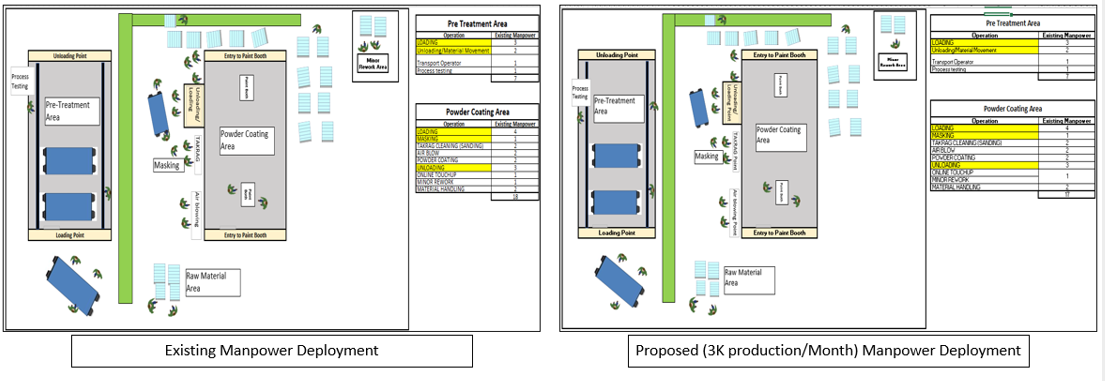
- Analysis (Work distribution/VA-NVA identification) for manpower calculation, optimum manpower utilization & identifying capacity.
- Dashboard preparation for production planning as per demand.
- Improvement & suggestions for fatigue reduction & making existing system better.
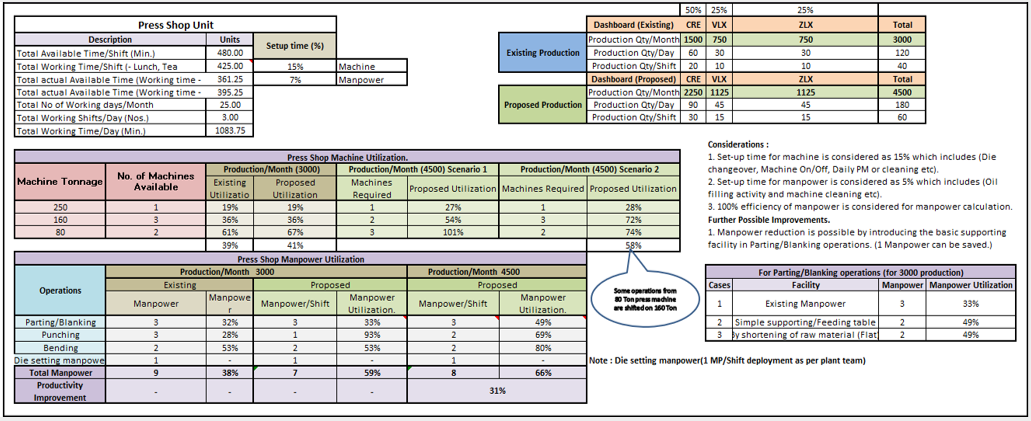
Results & Conclusion
After doing analysis and evaluation following results were obtained –
- Improved productivity by 67.3%.
- Fatigue reduction by rotation of operators in between lines & by introducing low-cost automation.
- Dashboards for future planning as per demand & as per working lines.

Overall Summary Dashboard
- Improvement and Suggestions
-
- Special fixtures suggested wherever necessary to reduce the dependency of extra manpower to hold the work piece.
- General improvements such as special markings for inventory level to be incorporated, oil dispensers to be available at required locations, etc.
Let our experts show you how our Services can support your projects!
Send a message to our team by filling out the form below. Describe your project, ask questions, or even request a bid.
An expert from our team will be in touch with you within one business day!
Want to schedule a time to speak with one of our representatives NOW?


